Adjudication Reporting Dashboard
We hold ourselves accountable to the sector we serve, the customers who use it and to each other through integrity of governance, clarity of process and independence of decision making. As part of being accountable, we are therefore reporting on adjudicative performance through this dashboard.
Our Adjudicative Reporting Dashboard provides regulated entities with more transparency into our adjudicative process, in particular the metrics and targets we have set to measure the efficiency of our decision-making. First published in 2021, the dashboard is updated twice per year.
What follows is a summary of achievements against our adjudicative targets for the 2024-2025 fiscal year.
Current Report
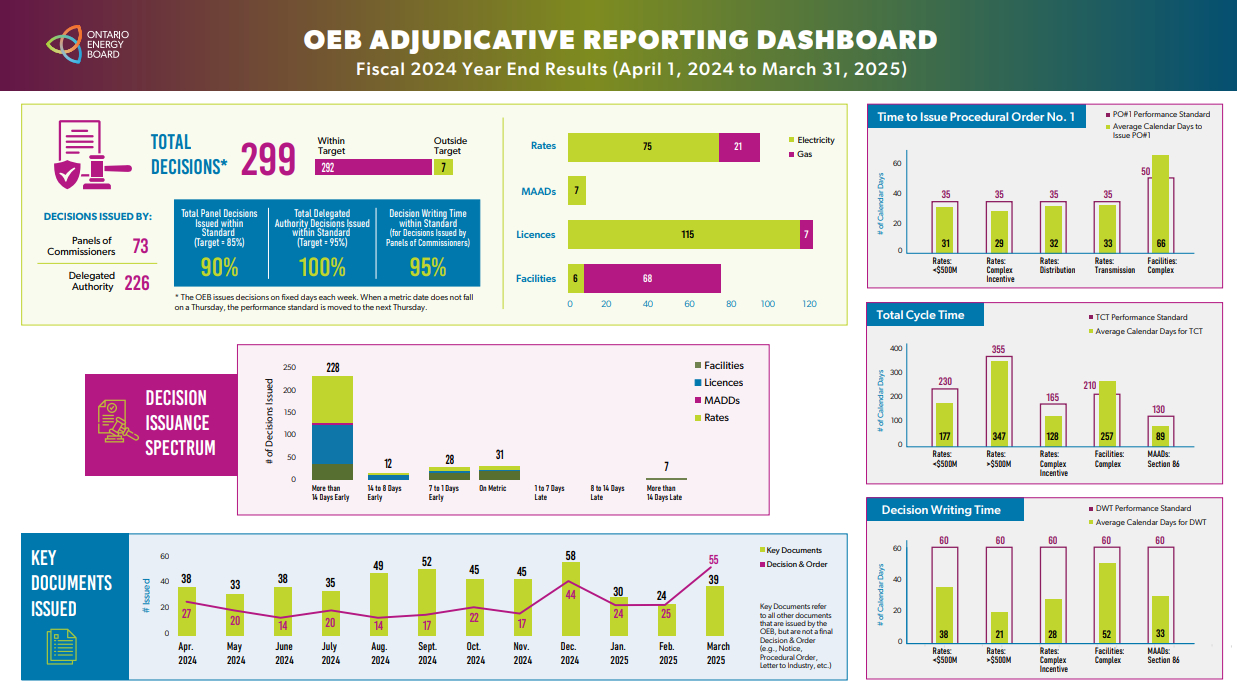
Fiscal 2024-2025: Year End Results (April 1, 2024, to March 31, 2025)
- The OEB issued 299 decisions in Fiscal 2024-2025 – 90% of panel decisions and 100% of Delegated Authority decisions were issued in accordance with the total cycle time performance standards (the panel target is 85% while the Delegated Authority target is 95%).
- Of all decisions issued, 74% were issued more than 14 days in advance of the decision metric date.
- March 2025 was the month in which the most decisions were issued by the OEB. Fifty-five decisions were issued in this month, or 18% of all decisions).
 Click here for a print version (pdf) of the dashboard or scroll down for more detailed information on each component of the dashboard
Total Decisions Issued
The majority of decisions (76%) issued by the OEB were heard by Delegated Authority. This is consistent with historical trends.
68% of the decisions issued in Fiscal 2024-2025 were for applications related to electricity.
41% of all the decisions issued were for Licence applications, Rates comprised 32% of decisions, followed by Facilities (25%) and Mergers, Amalgamations, Acquisitions and Divestitures (2%).
Decision Issuance Spectrum
In addition to monitoring whether a decision is issued on time or late, the OEB also monitors the degree to which decisions were issued early or late relative to the total cycle time decision metric date established by the applicable performance standard. This Decision Issuance Spectrum highlights the fact that 74% of decisions issued this reporting period were issued more than two weeks in advance of the total cycle time metric date. Two key drivers of this are that (a) licence applications tend to be mechanistic and therefore adjudicated under delegated authority and (b) complete settlement proposals were filed in several rates proceedings, which generally reduces the amount of time required for decision writing by Commissioners.
Key Documents
The OEB issues many documents aside from decisions each month. Key Documents refers to all other documents that are issued by the OEB but are not a final Decision and Order (e.g., Notice, Procedural Order, Letter to Industry, etc.). The OEB issued 41 Key Documents on average each month of Fiscal 2024-2025.
Average Time for Procedural Order No. 1 (PO#1), Decision Writing and Total Cycle
The OEB has committed to report on the performance of key application milestones for applications heard by panels of Commissioners for major application types. The three graphs illustrate the performance for various application types relative to the performance standard for:
This graph provides the average time from receipt of a complete application to the issuance of PO#1 and compares this to the performance standard. For complex facilities applications, the average time to issue PO#1 exceeded the performance standard. This was the result of additional time being required to address non-standard intervention requests and other issues in two applications under the Municipal Franchises Act.
This graph provides the average time from the close of the record to the issuance of the decision and compares this to the performance standard.
The average decision writing time for the Rates <$500M performance standard is lower than the metric of 60 calendar days because several applications heard under this performance standard achieved full settlement proposals that were accepted by the OEB. Full settlements generally reduce the amount of time required for decision writing relative to the performance standard.
This graph provides the average time from a complete application to the issuance of the decision and compares it to the performance standard. As noted above, several facility applications filed under the Municipal Franchises Act dealt with non-standard issues and exceeded the Total Cycle Time metric.